How to be a good storyteller

When doing analysis, data scientists try to generate actionable insights about the data.  But actionable insights by themselves, do not matter.  What matters is that those insights actually lead to positive business impact.  One way to increase the likelihood that your analysis will positively change business actions and decisions is by improving how you communicate about your data insights.  In this blog post, I will discuss the skill of “storytelling.”  Good storytellers are fantastic at getting their analysis over that “last mile” – from actionable insights to action – because they build narratives that change people’s motivation and thinking. 

Good storytellers know what a data story is. 

A data story is a narrative about the world that is justified by data.  It tells people about something important that is happening with their users, their product or the company.  A story explains why it matters, and why it is happening.   If your audience understands the story, they should be able to project what the will lose out on if they don’t act and how they stand to gain if they do. 

If you want some good examples of how to build a narrative around data, look at how journalists do it.  This article, for example, discusses narratives about how the pandemic is changing the primary locations of the tech industry.  If you believe this story, you can use it to decide where would be a good place to locate a new start-up or where you can move to if you both want a lower cost of living than San Francisco but still have a lot of opportunities for jobs in tech.

Good storytellers know what a data story is not.

A data story is not a list of findings from an exploratory data analysis (EDA).  Sometimes, when you are new to a product or a data set, you need to engage in EDA before you can start to build a story and sometimes it can be worthwhile to present this “lay of the land” to your audience, such as when you need to build up context or provide baselines before you move into your story.  A whole presentation about EDA, however, is like a novel that describes a world (“The mountains are surprisingly tall and there is more ocean than land!”) but doesn’t tell you anything about what is happening there or why it matters.  

A data story is also not a list of findings even if they are all actionable and interesting, because data findings themselves are not a story.  The story sits above the data findings.  If you look at the narrative about tech migration, there are multiple data findings underlying that narrative, but you can potentially not remember even a single one of them but still know the narrative (e.g., SF is on the decline; Austin and Miami will be the new hot spots!).   A list of data findings must all be tied together into a cohesive narrative, otherwise they are just a list of findings.  

A data story is not about your personal journey to discover data insights.  If you focus your narrative on the path you took to arrive at your conclusions, you risk people remembering your journey instead of the narrative about the data.  If you realize that the first questions and hypotheses you set out to explore aren’t as important as newly discovered ones, reset your story with the new problem and present it like that was the story from the start. 

Good storytellers use a key set of building blocks to help tell their story 

In a business setting, a data story should contain some key building blocks.  It should start with  a clear business problem (ideally only one) and a question or set of key questions about that problem.  The story should provide the big picture information and context on the problem (why is it a problem?), before zooming in on details.  Good storytellers postulate concrete hypotheses to answer their key questions and make it clear what they think that hypothesis predicts (i.e., what you expect to see in the data if it is right). Hypotheses and predictions most of the time should come before the data.  After validating hypotheses with data finding, stories will then zoom back out to provide a clear summary (hammer the take-home points!) and provide recommendations for concrete actions to take.  

Good storytellers do not worry about explicitly labeling these building blocks with technical terms (e.g., “my hypothesis is”), because this is not a school presentation and some audiences may not know or care what a hypothesis is.  They still, however, use them to structure their thoughts and guide the narrative.

A longer story sometimes needs to zoom in and out and touch multiple sub-questions.  A good story, however, will not lose track of the key problem and question being addressed or what it set out to do.  At any point in the story the audience will clearly know how the current point ties to the overall problem that is being addressed and ultimately feel like the main question has been answered.  Good storytellers will step back from their slides and examine the organizing narrative and make sure the building blocks are appropriately placed to emphasize the right points in the needed places.

See this previous blog post on the difference between questions, hypotheses, and predictions.

Good storytellers build expectations in their audience’s minds

Bad storytellers present their data and only then begin to explain how it fits into the broader narrative.  Good storytellers start by postulating a clear hypothesis and prediction before showing data.  That way, when your audience looks at a data point or figure, they will have the mental framework needed to know what they should be looking for and why you are showing them that data.  Good storytellers get their audience to ask themselves “is the prediction confirmed?”  

Setting expectations about what to look for in the data decreases the likelihood that audience members will create their own explanations of the data when you show them data.  Good storytellers control their audience’s attention so that it revolves around their story.

Good storytellers sometimes build expectations to create some suspense.  Suspense also makes people pay attention and, in turn, remember.  Even data stories can be fun! For the right audience, feel free to even ask your audience guess the answer before you reveal it.

Good storytellers know that the audience will remember the narrative, not the data.

Your audience, the majority of the time, does not leave your talk thinking about specific data findings.  After a week, most people, except maybe your data-science teammates, will have forgotten your visualizations (see exception below).   What people remember about your presentation is the story.  The implications of the story is what excites them and drives actions.  

Good storytellers are aware of this fact, and it is why they don’t make data findings the focus of the presentation.  They identify the narrative they want their audience to leave the talk thinking about, and all the data, figures, and slides they present, are used to support this narrative.     

Bad storytellers, in contrast, make data points the star of their talks.  They present data and then try to explain why it is interesting.  They present data and then hope that the audience will create their own stories about it.  They present lots of data – too much data – on a slide because they hope that it will generate an interesting conversation.   Do not do this. 

Good storytellers know that the visual that does get remembered is the one that best distills the narrative

Sometimes, if you’ve done a great job, a data point or a figure will be remembered.  It will make its way around the office or get added to other presentations.  The visualizations that succeed this way are typically the visualizations that clearly distill the crux of your narrative into one figure.  They tend to be figures that are easy to interpret and cannot be interpreted in any other way (i.e., they don’t support competing narratives).  In other words, these figures are successful because they make it very easy for people to learn and remember the narrative.  Do you have a figure like this in your presentation?

Good storytellers present the least complex figures possible.  

I know the temptation to use complex, cool-looking figures.  So many interesting findings pop out of them!  And they are beautiful!  Besides, you used this figure in your analysis so it is the easiest thing to do at this point, right?  But do not do this.  When you add a figure to a slide, you should always ask yourself “is this the simplest figure I can possibly use here?”

How do you know what is the simplest figure you can use?  Well, first, you have to know exactly what point you are trying to make on that slide.  What part of your story are you supporting with this figure?  You cannot simplify your figures if you aren’t quite clear how it supports this part of your narrative.   Second, the simplest figure is the one that best distills down the point you want to make on that slide.  If your figure contains information unrelated to the point you want to convey on that slide, then it is too complex.  Even if that information is very interesting, in this context, it is noise; it distracts from your story. 

Good storytellers try to not make their audience think when explaining data

Take a page from design principles:  “don’t make me think.”  You want to make it as easy as possible for your audience to understand the story.  Do not expect them to think through the problem or to figure out the implications of a data finding on their own. Spell it out for them slowly, clearly, and repeat it throughout the presentation.

When presenting figures, control the audience’s attention.  Make sure everyone understands the figure – usually start by explaining the y- and x-axes.  Define exactly how you calculate the metrics used in the figure.  Nobody should need to ask for clarification.  Walk people through the figure.  If you do need to include a more complex figure, focus their attention on one part at a time. Tell them exactly where to look – use slide transitions.  Find ways to visually highlight the part of the figure you want them to focus on in that slide.  

Explicitly state if a data finding supports or does not support the prediction of a hypothesis.   If your data point helps elucidate something about a question, then say how.  Do not expect your audience to tie the pieces together.  Do it for them.

In many talks about data, you have to introduce new concepts or new terms.  Define and explain them well early in the presentation so that you do not have to do so repeatedly later on.  Give concepts and segments intuitive names; avoid acronyms or abbreviations.   In many talks, your metrics or analysis may be limited in some sort of way.  It may also be good to deal with this at the start so that you do not have to keep adding caveats to all your statements.

You should simplify, organize, and standardize your slides as much as possible.  For example, I like to have a slide title that contains the prediction or question, a figure, and the text with the slide’s key finding/point/learning (hypothesis validated!).  It enables you to mentally flow through the figure in the correct order (i.e.,, prediction -> finding -> learning).  Minimize text. Try to avoid having multiple bullet points and a graph on the same slide; people won’t know where to look and will spend their time exploring your slide instead of listening to you. Avoid tangential points.  Feel free to add extra information to the presenter notes for people to read later on, but resist the urge to keep it in the slide.

Good storytellers make sure their story is justified.

If you get your audience to believe in the wrong narrative, it can have a serious negative business impact.  Stories need to be justified with data and good analysis.  For example, the article I shared earlier tried to challenge the common narrative about the impact of the pandemic on the location of the tech industry.  But the analyses were flawed (see if you can identify reasons why!).  This failure means that the narrative may not only be wrong but, if you were using it to decide where to live or start a business, potentially quite dangerous.  Select metrics and make comparisons carefully.   Know the limitations of your metrics and comparisons.  A key part of data storytelling, in a business context, is building trust with your audience that your narrative is correct. 

Good storytellers put stories together before conducting analysis.  

Good storytellers use their business and product sense to try to tell a compelling and important story before they start their analysis.  Good storytellers will work with business partners to test out these first-pass stories and get buy in before starting their analysis.  When the data scientist starts the analysis, the goal is to try to justify that story and to examine competing narratives.  Usually, in the course of an analysis, as new insights and ideas emerge, the story changes or becomes more fleshed out.  You may realize that there are key follow-ups and take the story down further along than originally planned.  As you realize this, step back again.  Try to recreate your full story.  At that point you may realize what parts are still not justified (e.g., unclear if X is the right action to take).  Focus on justifying them.  Create a presentation only after the narrative is justified. 

I can often tell when analysts have created their story after doing their analysis.  One key symptom of this is a presentation containing bullet points of findings.  Another symptom is a narrative that is not sufficiently justified – if you create your story after you are done analyzing data, then you will be stuck stitching together whatever findings you have.  Generally, ad-hoc narratives feel disjointed and uncompelling and they are more likely to be forgotten by the audience.   If you want to tell a good story try figuring out up front what pieces of evidence you need to assess it.  Iterate your story as you examine new data points.  Again, start with your story.  

Good storytellers are aware of prior stories 

If you want to spin a narrative, it is critical that you be aware of whether there is already a current narrative answering that question.  This prior story may be based simply on people’s intuitions or assumptions and not be data-driven or it may be a data story previously told by another data scientist.   If this prior story exists, it is helpful to address it explicitly.  If there is strong belief in this prior story, just as in Bayesian statistics, you will need more evidence – more justification – to overcome it.  If there are no prior beliefs, you have a blank canvas and it is easier to write a story on a blank canvas.  

One reason why you need to provide extra justification for a new narrative that competes with an old one is that you risk persuading only part of your audience that the new narrative is right, which could lead to half of your team believing in one story and the other half believing in another.  If you work in science, conflict is a great impetus for pushing knowledge forwards.  But in business, conflict and uncertainty reduces likelihood of action and impairs strategy.  

In this context, you really do want to think twice before challenging the narratives created and sold by other data scientists.  The team will become overall ineffective in driving impact if they go back and forth on narratives because the team will be viewed as less trustworthy.  Ideally, a team of data scientists will align on and build upon each others’ narratives.  Over time, this can lead to organization clarity around strategy and actions.  That said, of course, previous narratives do sometimes need to be challenged.  If you think you are in this situation, make sure you understand the past analysis well and exactly why it led to different conclusions. Talk to the data scientist who did the analysis, if possible, and work through it together.  If you still want to challenge it, then, again, bring extra justification.  

Good storytellers know their audience. 

What does your audience care about?  What problems are they facing?  What decisions are they trying to make?  Your data story should help your audience. You need a clear sense of their needs to do so.  Make sure you understand the world view and the language of your audience, including the specific jargon they use; present from that perspective and use that language.  If you are presenting to executives, you may need to tailor your talk to them in particular – how you present,  how much data you present, the speed at which you move through data, the level of detail you go into – based on how they prefer to consume information (see this  excellent article by Will Larson for more on presenting to executives). The more that you can customize your narrative for your audience, the greater the likelihood that they will be engaged and persuaded by it. 

Good storytellers encourage conversation. 

I have talked a number of times about controlling your audience’s attention as a way to communicate your narrative.  This does not mean that you do not want them to think at all.  What you want is for them to carry your narrative forwards.  What are the implications you may have missed?  If this is right, what actions should they be taking?  What surprises them about it?  Should they re-evaluate their current approach?  The conversation your story elicits is often the most impactful part of the meeting.  It helps the team build consensus and excitement about your ideas.

One of the best ways to encourage this type of thinking is to give space for conversation.   Do not wait until the end of the presentation to provide this space, because it will be accidentally cut if your talk goes long. People may also forget important points that would have led to good debate if raised earlier.  A great time to provide space is right after you present data validating the prediction of a hypothesis.  It encourages people to discuss what they should do differently given that this hypothesis seems to be true.  When you give space, give more time than you think.  It can feel uncomfortable but people need time to collect their thoughts.  

** Thanks to the data-science team at Calm, particularly Ben Paul, Will Downey and Heather Lin, for conversation, suggestions and feedback on the first draft of this article.


Four communication techniques for solving technical problems

All data and engineering teams are faced with a constant inflow of organizational, technical, and interpersonal problems and the ability of your team to have business impact will depend largely on how effectively it can move towards optimal solutions to those problems.  In this article, I discuss four communication techniques that improve the ability of a team to solve problems.

Work from the problem to the solution:  move in the right direction.

When presented with a problem, first spend time elucidating the problem space before addressing potential solutions.  Interestingly, I think the intuitive and most common approach is to do the opposite: present and advocate for your solution.   I think the reason for this is that people tend to assume that others understand the problem as clearly as you do, that you have a full understanding of the problem, and that you understand which aspects of the problem are the most critical to solve for the business.  Thus, the only thing that is interesting is the solution you came up with – a solution that is either clever or based on your notable experience. 

The problem though is that these assumptions are usually wrong.  Typically if you spend time first fleshing out the problem, you will realize that other people on the team have context on the problem that you don’t have.  Or that they do not share an understanding of what the problem is or that there is disagreement about what aspects of the problem are the most critical to solve first.  Often you will realize that people are focused on solving the technical problem but that they do not have a good understanding of the business problem.  It is critical that the business problem is clearly fleshed out before addressing the technical problem.

Recommendation.  Spend time talking about the problem before anyone presents solutions.  It will make sure everyone has the same context.  It ensures that the business problem is the focus and that people will agree – before presenting their solution ideas – which aspects of the problem are the most critical to solve. This process helps remove ego from the conversation, which can develop when a group of smart highly experienced present different solutions that incidentally emphasize different aspects of the problem.  Time spent on the problem space consistently will help you identify better solutions, more efficiently, and with less drama.

Split-tracking – prevent circular and chaotic conversations. 

I have seen a number of conversations about thorny problems go in circles and not only fail to identify good solutions but even make little progress towards a shared understanding of the problem space.  How do you prevent this from happening?  The primary thing to do is to keep your conversation organized.  

One way to do so is to use a technique called split-tracking.  Split-tracking is a technique, in which you identify that more than one issue or concern has been raised, bring group awareness to this observation, generate consensus that there is more than one issue at play, and then push others to focus on one issue at a time.   Why does this help?   People often don’t realize that they are conflating two issues so they don’t realize when they are jumping back and forth between these issues.  If these issues are not explicitly identified and separated, it can be hard to probe and press a person’s thinking on an issue – they can unconsciously side-step into the second issue. If there are multiple people discussing a problem, it is possible for people to start going in circles if different people re-direct the group to a secondary issue and then another person brings it back to the first issue.  

Recommendation.  Be on the lookout for multiple underlying issues and concerns.  If you see them, stop the conversation and say, “I am hearing two issues here.  One is issue $X and other is issues $Y.  Which one should we focus on first?”   Make sure other people realize that there are separate issues – even if they are correlated – and get them to agree to work on them separately.  In general, think like a scientist – care about the taxonomy of your problem and neatly classify all the sub-problems that exist and their relation to each other (i.e., this is a subproblem of this bigger problem).  You can work towards a solution much more effectively, if the problem space is well organized and explicitly understood by everyone in the conversation. 

Empathy – prevent friction and “land mines” from stopping forward progress.

Have you ever been in a meeting discussing a problem, making some progress, and then just suddenly had all forward progress come screeching to a halt?   Usually this happens when people become defensive or if the conversation triggered an emotional response in someone.  How do we prevent this from happening?  Although each individual needs to work to keep the bigger picture in mind and to keep their ego out of the conversation, you cannot control other people’s reactions.  So what can you do? 

Recommendation.  Work on being more empathetic in your communication.  Carefully consider how others view the problem and how some aspects of the problem may impact them and their work more than you.  Consider that even if they have less relevant experience than you, that they still want their viewpoints to be considered and valued.  In general, approach people and their thoughts with curiosity.  Try to clarify your understanding of their perspective and make it clear that you are spending time trying to understand their views.

If you do this, you will be less likely to trigger an emotional response that will put a lot of friction between you and your solution.  You will make people feel heard even if the solution that is ultimately arrived at doesn’t solve their main pain points. When you approach problems empathetically, it is also easier to build consensus and excitement in the group, which is critical. Identifying the solution is not the final step – implementing the solution is, and you want a motivated team to tackle that step. 

Emphasizing empathy when working with others has a few other advantages.  One, because empathy is driven by curiosity about someone’s perspective, it makes it easier to identify genuine issues that you hadn’t been considering previously, thereby enriching your understanding of the problem.  Two, it will help you identify nuances in the concerns of others, providing opportunities for split-tracking and organization of the conversation.  Three, empathetic communication enhances psychological safety of the group, which in turn means that all people will feel comfortable voicing their concerns and insights. A group that can communicate openly will be better at fleshing out the full problem space and thereby will be better at identifying the optimal solution.   

Lastly, I would like to note although people inherently vary in how empathetic they are, it is also a skill that can be cultivated.   So make it a mindset that you work actively to engage in.  Cultivate your curiosity. If you struggle with it, try meditation. Its core teaching is the power of developing an open loving curiosity about the world.  I’ve spent a week in silent meditation, and I can tell you that if you can find the in and out flow of your breath to be fascinating, then it becomes easy to be intrigued by the perspective of your peers. 

Monitoring – keep the conversation within the lines

Monitoring – keep the conversation on track

The part of the brain involved in understanding and solving a problem, the dorsolateral prefrontal cortex, is distinct from the part of the brain, the medial prefrontal cortex, that is involved in monitoring your environment and behavior for errors that signal a course correction is needed.  I have noticed that leaders, who are great at moving a team towards optimal solutions, are able to keep this monitoring brain area highly activated even as they also help the team move towards a solution.  They tend to be constantly scanning the conversation at a meta-level looking for issues that will derail it.  So what type of issues are they monitoring for? 

Establish what you are monitoring for and set the conditions.  To know what to monitor for, you first need to clearly identify, at the start of a meeting, what your agenda is and what the basic problem(s) is that you will address.  Once there is consensus here, it will be clearer to you if the conversation has moved off track and what you should be monitoring for.  Moreover, it also ensures that you have needed conditions for keeping the conversation on track.  For example, given your agenda, you should evaluate whether you even have the right decision makers in the room.  Do you have unnecessary people who can push the conversation into tangents or are you lacking the needed people so that even if you make a decision, you may not be able to act upon that decision?   

Conversation below the right level?  Is someone “going into the weeds” by diving into a technical explanation that isn’t needed right now?   Monitor for this and pull the group out quickly.   At best, it is just a waste of time.  At worst, it will derail the conversation. 

Conversation above the right level?  Similarly, thoughts can steer the conversation to a level above the agenda.  For example, if your company recently switched to a pods organization and there is some question about how to best handle ownership of one line of work in this new pod structure, it can be easy for the conversation to suddenly be about the pods themselves – whether they are good and how to change and improve the pods.  This level of conversation would be above the one set in your agenda, is not one that you want to or are capable of addressing in your current meeting, and if you even were interested in addressing it, you probably don’t have the right people in the room to do so.  Pull conversations back down to the appropriate level if they go above it.

Conversation moving tangentially?  Conversations can also move laterally away from the agenda.  Monitor for people who raise issues, even if they are correlated, that do not fit in the current agenda.   If you are focused on understanding one technical problem, be wary if another connected problem is raised.  Does this other problem truly need to be incorporated into the problem space you are fleshing out or can this problem be worked on separately?  If you see this happen, quickly note it to the team as a problem for another day if that is what it is.   In conversations about interpersonal conflict, be on the lookout for other types of tangents.  For example,  “whataboutism”, in which a person intentionally directs attention away from one problem to another one.  You stop making progress on an issue when you stop addressing it.

Does the conversation have good pace or has it become stuck?   Another thing effective leaders do in conversations is to monitor for whether the conversation is moving forwards on time or whether people have started to “spin their wheels.”  It is critical to flesh out the problem space but you have a limited amount of time to do so.  I recommend considering the 80/20 rule of business in this context.  For every sub-issue in a problem space, you will arrive at 80% of the possible insight and understanding with 20% of effort.  Sometimes, you really need to dive deep and understand subcomponents of the problem more deeply.  But if there are multiple sub-issues in a space, there is opportunity cost for doing so.  Thus, instead push the conversation forwards to cover the other sub-issues.  Once you have the problem space fleshed out, you will be better situated to understand where the deeper work is needed.  In other words, avoid premature optimization when discussing and solving problems.  

Conclusions

As you deal with new problems that are technical, organizational, and interpersonal in nature, I would encourage you to use these four approaches to help your group move more quickly towards an optimal solution:  1) go in the right direction by working from problem to solution;  2) prevent circular, chaotic conversation by split-tracking;  3) remove friction and land-mines by emphasizing empathy;  4) monitor for conversations becoming stuck or moving above, below or tangentially away from scope set out in your agenda. 

 It is not only critical that the leader of a team uses these techniques but it is also important that everyone in the group understands them and advocates for them during conversations as well.  A team will move slowly towards the optimal solution if they depend on their leader to consistently course correct them.  To build awareness in the group, identify these concepts and terminology and consistently bring attention back to the concepts and terminology.  Once the terminology is part of your group’s idiom, you will hear people in your group besides you course correcting the group without your input.  

Using the scientific method to improve your AB testing

One advantage that Calm has had over its competitors is a strong culture around experimentation.   How did we build that and what goes into it?  The vast majority of articles on the role of data-science in AB testing discuss ways to make your testing process rigorous.  For example, you should run power analyses to determine how long to run your test before checking results for statistical significance.  What is rarely discussed, however, are methods for making your experimentational process as effective and efficient as possible. In other words, how do you figure out what the best version of your product is as quickly as possible?   In this article, I will discuss how to use the scientific method to achieve this and common pitfalls and misunderstandings that hold your experimentation practice back.  

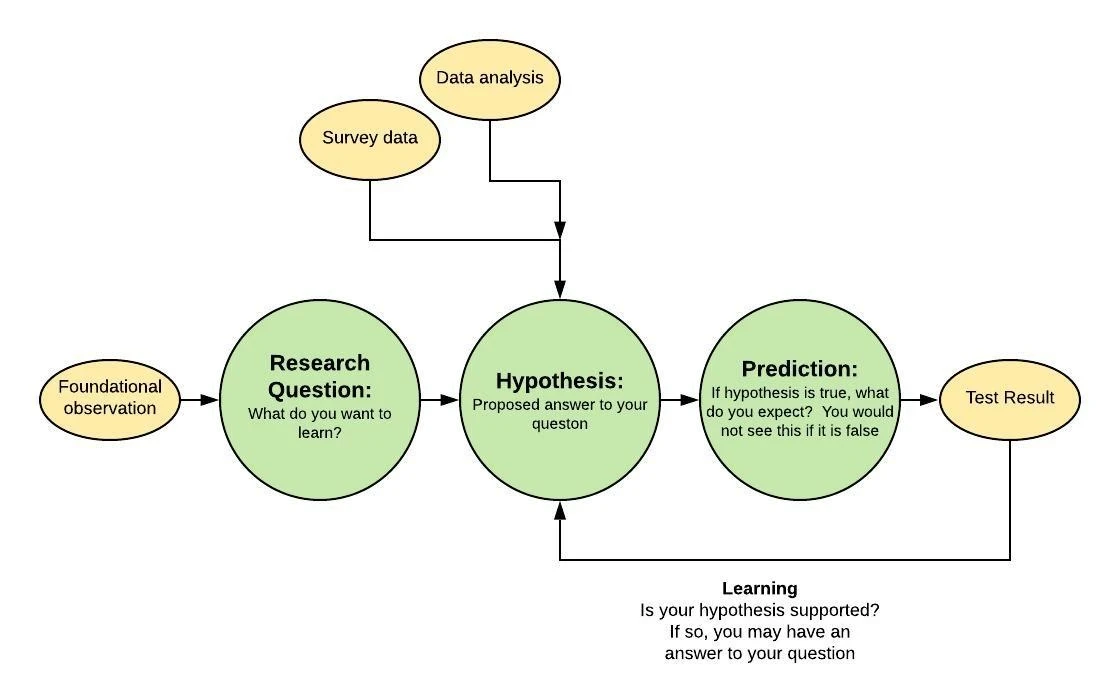
Scientific method:  Research question, hypothesis, and prediction

To understand the scientific method, it is critical that you first properly understand the difference between a research question, a hypothesis, and a prediction.  The scientific process starts by determining what you want to learn about and posing it as a research question.  Why are so many of our users not converting?  Why are some people but not others forming a habit?  Generally “yes” or “no” questions should be avoided because they lead to very limited learnings – yes or no.  Try to formulate questions in a way so that if you answer it, the answer will have important implications.  Research questions sometimes arise from surprising data findings.  For example, we once saw that Calm users were meditating at the end of the evening, which isn’t an expected time for meditation, and wanted to understand why.  Often though, you already know what you want to learn about – something that you know will impact your business.

In the next step, you develop hypotheses, which are explanations or answers to your research question.  For example, people don’t know that they need to develop a habit to see the benefits of Calm or they want to develop a habit but keep forgetting to practice at established times. Hypotheses should be developed outside of the context of any specific test or prediction, so that you identify the best explanations, not just explanations that are easiest to test.  Good hypotheses should be testable however.  Good hypotheses also are not guesses. They should be guided by external research (e.g., cognitive research on habit formation), previous AB testing, marketing research, survey results, and data analysis. 

Once you identify a hypothesis you want to examine, you use it to make predictions.  Assume your hypothesis is correct, what would you expect to see and not expect to see?  If users are forgetting to meditate, if you enabled them to set up a reminder to meditate, you should see an increased number of them developing a meditation habit.  Tests are set up to see if you can confirm this prediction. The point of the test though is use that confirmation (or lack of one) to learn about the hypothesis. Good predictions are predictions that only your hypothesis would make, because, otherwise, if you confirm the prediction, you won’t have learned which one is correct.  Thus, you may be no closer to finding a good answer to your question.

Pitfalls and Misunderstandings

Not considering the wider possible set of research questions and hypotheses before prioritizing.  At the start, flesh out all the research questions you may want to answer.  If you can see all the possible options and prioritize them as a team, it will ensure that everyone agrees that you are trying to learn about an area with the most potential business impact and decreases the chance that you will waste time pursuing suboptimal questions.  Sometimes when you do this, it will help you realize that you should answer one question before addressing another one.

Once you identify the research question(s) you want to address, then spend time identifying a broad set of hypotheses.  This ensures that you do not simply prioritize ones that are the easiest to test or the first to come to mind.  Instead you want to prioritize hypotheses that are most likely to effectively address your research question.  Comparing different hypotheses also help you refine your hypotheses.  Does a person not convert because they cannot afford it or because they do not think it is worth as much as you charge?  If you consider only one of these hypotheses isolation, you may not realize that these hypotheses are distinct and lead to different predictions.  

Building out a list of potential hypotheses often helps you identify hypotheses that are conflicting.   For example, one hypothesis may be that users will find our product more valuable if it contains more content that can be passively consumed versus another that posits that users will find our product more valuable when it challenges them and makes them expend energy to grow.  These conflicting hypotheses lead to very different predictions and pathways in product development. Be on the lookout for contrasting ideas!

Failing to abandon a weak hypothesis.  Try to establish ahead of time what failure or set of failures would make you abandon a hypothesis.  It can be hard to be certain that a hypothesis is bad if one prediction is not confirmed – try as you may, tests are not perfect!  But perseverating on an idea that has little support decreases efficiency of your testing program.  In general, given opportunity cost, pruning down hypotheses, and moving on to new areas, is one of the most important learnings you can have as a company.   This is another good reason to have a prioritized list of hypotheses.  If you know that you have other good ideas to examine, you will have more motivation to abandon a weak hypothesis.

Not using data to evaluate and prioritize hypotheses.  Product tests, especially at start ups, can involve a couple months of work to move from the speccing stage all the way to final analysis and decision. One way to speed up your testing program though is to find alternative ways to assess the likelihood of a hypothesis before examining it.  You can run surveys, do market research or work with a user researcher.  You can also work with data analysts.  Make predictions about what you would expect to see in your current data if the hypothesis is true.  Analyses like these can be answered much more quickly than a test, sometimes in a couple hours, and will help you prioritize which hypotheses are likely and worth further pursuing.  

Outcome focused instead of learning focused.  Ultimately the goal of a testing program is to improve your critical business metrics, i.e, Key Performance Indicators (KPIs).  However, it is easy for researchers to become focused on KPIs and lose focus on learning about their users.  At worst, a company with a poor research culture will devolve into “throwing spaghetti at the wall to see what sticks,” running experiments with minimal rationale, with ideas based on simple optimization tweaks (e.g., change the font size!) to see if they move the metric.  

Teams that are focused on learning, however, are trying to understand their users – their needs, their motivations, and their problems.  They want to build knowledge up over time so that a series of experiments, together as a whole, effectively and efficiently resolve critical research questions.  They want to learn as much about what they should do as what they shouldn’t do.  They want to build up narratives about their users.  They are looking for deeper insights that can change the product direction.  For example, if you have a freemium product, instead of simply seeing if a product change successfully led to more conversions, you may want to figure out if users are most motivated to convert upon arrival or if they instead need to spend time using the free content in the app before they will convert.

Choosing a test metric based on desired outcome, not on what you want to learn.   If you are trying to obtain a specific outcome, such as positively impacting a KPI, you will use that KPI to assess whether your test was a win.  However, if you are trying to learn, you should use the metric that best enables you to assess whether your hypothesis is supported.  This metric may be the KPI but not necessarily.  For example, if you have a KPI that measures engagement but your test is specifically interested in habit formation, then use a metric that measures habit formation if your KPI doesn’t.

If you use a metric that isn’t your KPI, sometimes you will learn something important but not see a significant impact on your KPI.  This could happen for a number of reasons. It may need more statistical power to influence the KPI versus the metric you are interested in.  Sometimes the impact on the overall KPI is washed out when are are learning about a specific segment. Sometimes you learn a lever for influencing your customers but you need to pull harder on that lever before it has a major impact on your KPIs.

Treating predictions and hypotheses as synonymous.  If you don’t treat a prediction and hypothesis as distinct concepts, you will probably miss the deeper learnings enabled by a clearly defined hypothesis.  In turn, this means that it will be less clear how to iterate if your test is successful or not.  If you focus on hypotheses, your focus is on learning about your users.

Brainstorming product changes not hypotheses or predictions made by hypotheses.  Sometimes it can be helpful to brainstorm up a bunch of product changes that your users will like, for example, with a hackathon.  Although some fresh ideas can be helpful, this should not be your dominant approach to iterating on your product.  The problem is, again, that a product change or prediction that is not developed explicitly to test a hypothesis, will often result in you learning notably less.  Thus, over time, instead of your experiments building on each other, leading to new narratives and deep understandings, you will be more likely to run a scattered series of tests.  Ask yourself what you want to learn.  Develop your tests to learn it.  Avoid testing an interesting product change and then figuring out afterwards what you want to learn.

Developing tests that fail to address your hypothesis.  Experimental design is challenging.  It can be surprising sometimes that small changes to your variants or how you implement a test will dramatically change what you can learn from the test.  I’ve seen researchers waste a substantial amount of time running experiments that are not capable of helping them learn what they want to learn.  Consult with data scientists when designing a test.  If you make changes to the design after consulting with them, pass it back by them before implementing it. 

Final Recommendations

Brainstorm research questions and analytically prioritize them.  Then generate a set of hypotheses for the chosen research question.  Refine your hypotheses and search for competing ones.  Prioritize which ones work based on past learnings, theory, and/or data analysis.  Spend time at this step; it is impactful.  After you decide what you want to learn and which hypothesis you want to test, only then generate predictions and test ideas.   Tests should be designed so that you will learn about what you want to learn – your hypothesis.  The test metric should be the metric that is the best metric for evaluating your hypothesis.  Before running that test, think through, if the prediction is not confirmed, what other ways would you want to test your hypothesis before abandoning it.  Aim to fail if it isn’t supported.  If your hypothesis is supported, move on to other predictions and ideas suggested by your hypothesis.