One advantage that Calm has had over its competitors is a strong culture around experimentation. How did we build that and what goes into it? The vast majority of articles on the role of data-science in AB testing discuss ways to make your testing process rigorous. For example, you should run power analyses to determine how long to run your test before checking results for statistical significance. What is rarely discussed, however, are methods for making your experimentational process as effective and efficient as possible. In other words, how do you figure out what the best version of your product is as quickly as possible? In this article, I will discuss how to use the scientific method to achieve this and common pitfalls and misunderstandings that hold your experimentation practice back.
Scientific method: Research question, hypothesis, and prediction
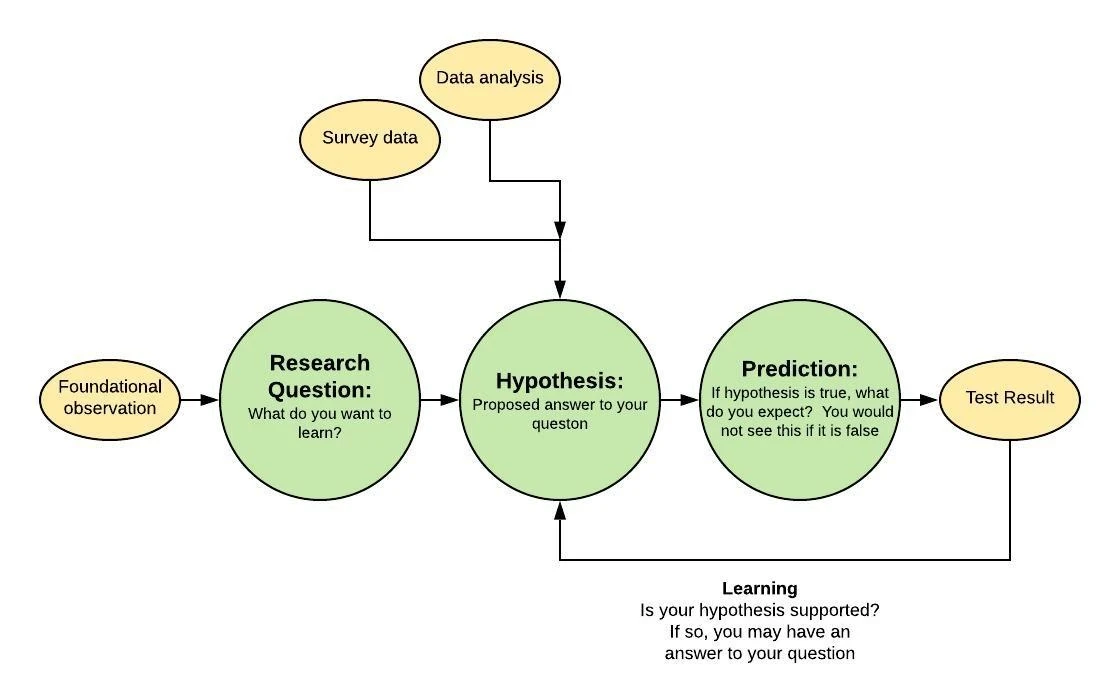
To understand the scientific method, it is critical that you first properly understand the difference between a research question, a hypothesis, and a prediction. The scientific process starts by determining what you want to learn about and posing it as a research question. Why are so many of our users not converting? Why are some people but not others forming a habit? Generally “yes” or “no” questions should be avoided because they lead to very limited learnings – yes or no. Try to formulate questions in a way so that if you answer it, the answer will have important implications. Research questions sometimes arise from surprising data findings. For example, we once saw that Calm users were meditating at the end of the evening, which isn’t an expected time for meditation, and wanted to understand why. Often though, you already know what you want to learn about – something that you know will impact your business.
In the next step, you develop hypotheses, which are explanations or answers to your research question. For example, people don’t know that they need to develop a habit to see the benefits of Calm or they want to develop a habit but keep forgetting to practice at established times. Hypotheses should be developed outside of the context of any specific test or prediction, so that you identify the best explanations, not just explanations that are easiest to test. Good hypotheses should be testable however. Good hypotheses also are not guesses. They should be guided by external research (e.g., cognitive research on habit formation), previous AB testing, marketing research, survey results, and data analysis.
Once you identify a hypothesis you want to examine, you use it to make predictions. Assume your hypothesis is correct, what would you expect to see and not expect to see? If users are forgetting to meditate, if you enabled them to set up a reminder to meditate, you should see an increased number of them developing a meditation habit. Tests are set up to see if you can confirm this prediction. The point of the test though is use that confirmation (or lack of one) to learn about the hypothesis. Good predictions are predictions that only your hypothesis would make, because, otherwise, if you confirm the prediction, you won’t have learned which one is correct. Thus, you may be no closer to finding a good answer to your question.
Pitfalls and Misunderstandings
Not considering the wider possible set of research questions and hypotheses before prioritizing. At the start, flesh out all the research questions you may want to answer. If you can see all the possible options and prioritize them as a team, it will ensure that everyone agrees that you are trying to learn about an area with the most potential business impact and decreases the chance that you will waste time pursuing suboptimal questions. Sometimes when you do this, it will help you realize that you should answer one question before addressing another one.
Once you identify the research question(s) you want to address, then spend time identifying a broad set of hypotheses. This ensures that you do not simply prioritize ones that are the easiest to test or the first to come to mind. Instead you want to prioritize hypotheses that are most likely to effectively address your research question. Comparing different hypotheses also help you refine your hypotheses. Does a person not convert because they cannot afford it or because they do not think it is worth as much as you charge? If you consider only one of these hypotheses isolation, you may not realize that these hypotheses are distinct and lead to different predictions.
Building out a list of potential hypotheses often helps you identify hypotheses that are conflicting. For example, one hypothesis may be that users will find our product more valuable if it contains more content that can be passively consumed versus another that posits that users will find our product more valuable when it challenges them and makes them expend energy to grow. These conflicting hypotheses lead to very different predictions and pathways in product development. Be on the lookout for contrasting ideas!
Failing to abandon a weak hypothesis. Try to establish ahead of time what failure or set of failures would make you abandon a hypothesis. It can be hard to be certain that a hypothesis is bad if one prediction is not confirmed – try as you may, tests are not perfect! But perseverating on an idea that has little support decreases efficiency of your testing program. In general, given opportunity cost, pruning down hypotheses, and moving on to new areas, is one of the most important learnings you can have as a company. This is another good reason to have a prioritized list of hypotheses. If you know that you have other good ideas to examine, you will have more motivation to abandon a weak hypothesis.
Not using data to evaluate and prioritize hypotheses. Product tests, especially at start ups, can involve a couple months of work to move from the speccing stage all the way to final analysis and decision. One way to speed up your testing program though is to find alternative ways to assess the likelihood of a hypothesis before examining it. You can run surveys, do market research or work with a user researcher. You can also work with data analysts. Make predictions about what you would expect to see in your current data if the hypothesis is true. Analyses like these can be answered much more quickly than a test, sometimes in a couple hours, and will help you prioritize which hypotheses are likely and worth further pursuing.
Outcome focused instead of learning focused. Ultimately the goal of a testing program is to improve your critical business metrics, i.e, Key Performance Indicators (KPIs). However, it is easy for researchers to become focused on KPIs and lose focus on learning about their users. At worst, a company with a poor research culture will devolve into “throwing spaghetti at the wall to see what sticks,” running experiments with minimal rationale, with ideas based on simple optimization tweaks (e.g., change the font size!) to see if they move the metric.
Teams that are focused on learning, however, are trying to understand their users – their needs, their motivations, and their problems. They want to build knowledge up over time so that a series of experiments, together as a whole, effectively and efficiently resolve critical research questions. They want to learn as much about what they should do as what they shouldn’t do. They want to build up narratives about their users. They are looking for deeper insights that can change the product direction. For example, if you have a freemium product, instead of simply seeing if a product change successfully led to more conversions, you may want to figure out if users are most motivated to convert upon arrival or if they instead need to spend time using the free content in the app before they will convert.
Choosing a test metric based on desired outcome, not on what you want to learn. If you are trying to obtain a specific outcome, such as positively impacting a KPI, you will use that KPI to assess whether your test was a win. However, if you are trying to learn, you should use the metric that best enables you to assess whether your hypothesis is supported. This metric may be the KPI but not necessarily. For example, if you have a KPI that measures engagement but your test is specifically interested in habit formation, then use a metric that measures habit formation if your KPI doesn’t.
If you use a metric that isn’t your KPI, sometimes you will learn something important but not see a significant impact on your KPI. This could happen for a number of reasons. It may need more statistical power to influence the KPI versus the metric you are interested in. Sometimes the impact on the overall KPI is washed out when are are learning about a specific segment. Sometimes you learn a lever for influencing your customers but you need to pull harder on that lever before it has a major impact on your KPIs.
Treating predictions and hypotheses as synonymous. If you don’t treat a prediction and hypothesis as distinct concepts, you will probably miss the deeper learnings enabled by a clearly defined hypothesis. In turn, this means that it will be less clear how to iterate if your test is successful or not. If you focus on hypotheses, your focus is on learning about your users.
Brainstorming product changes not hypotheses or predictions made by hypotheses. Sometimes it can be helpful to brainstorm up a bunch of product changes that your users will like, for example, with a hackathon. Although some fresh ideas can be helpful, this should not be your dominant approach to iterating on your product. The problem is, again, that a product change or prediction that is not developed explicitly to test a hypothesis, will often result in you learning notably less. Thus, over time, instead of your experiments building on each other, leading to new narratives and deep understandings, you will be more likely to run a scattered series of tests. Ask yourself what you want to learn. Develop your tests to learn it. Avoid testing an interesting product change and then figuring out afterwards what you want to learn.
Developing tests that fail to address your hypothesis. Experimental design is challenging. It can be surprising sometimes that small changes to your variants or how you implement a test will dramatically change what you can learn from the test. I’ve seen researchers waste a substantial amount of time running experiments that are not capable of helping them learn what they want to learn. Consult with data scientists when designing a test. If you make changes to the design after consulting with them, pass it back by them before implementing it.
Final Recommendations
Brainstorm research questions and analytically prioritize them. Then generate a set of hypotheses for the chosen research question. Refine your hypotheses and search for competing ones. Prioritize which ones work based on past learnings, theory, and/or data analysis. Spend time at this step; it is impactful. After you decide what you want to learn and which hypothesis you want to test, only then generate predictions and test ideas. Tests should be designed so that you will learn about what you want to learn – your hypothesis. The test metric should be the metric that is the best metric for evaluating your hypothesis. Before running that test, think through, if the prediction is not confirmed, what other ways would you want to test your hypothesis before abandoning it. Aim to fail if it isn’t supported. If your hypothesis is supported, move on to other predictions and ideas suggested by your hypothesis.